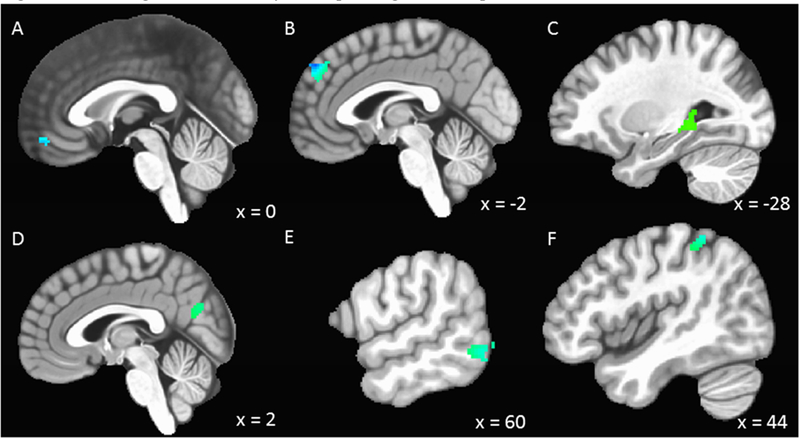
Figure 3: Brain regions with activity corresponding to within-person fluctuations in RSA and number of SCRs.

N=135. RSA = respiratory sinus arrhythmia; SCRs = skin conductance responses. (A) Increases and decreases in RSA were inversely related to activity in the ventral medial frontal gyrus. (B) Increases and decreases in the number of SCRs were inversely related to activity in the dorsal medial frontal gyrus. Whole brain analyses revealed a positive relation between change in the number of SCRs and activity in the left parahippocampal gyrus (C) and a negative relation with activity in the precuneus (D), right middle temporal gyrus (E), and right inferior parietal lobule (F). Voxel-wise threshold: t = 3.280, p = 0.001, Minimum cluster (ROI) = 28 voxels, Minimum cluster (Whole Brain) = 90 voxels; alpha <0.05.
