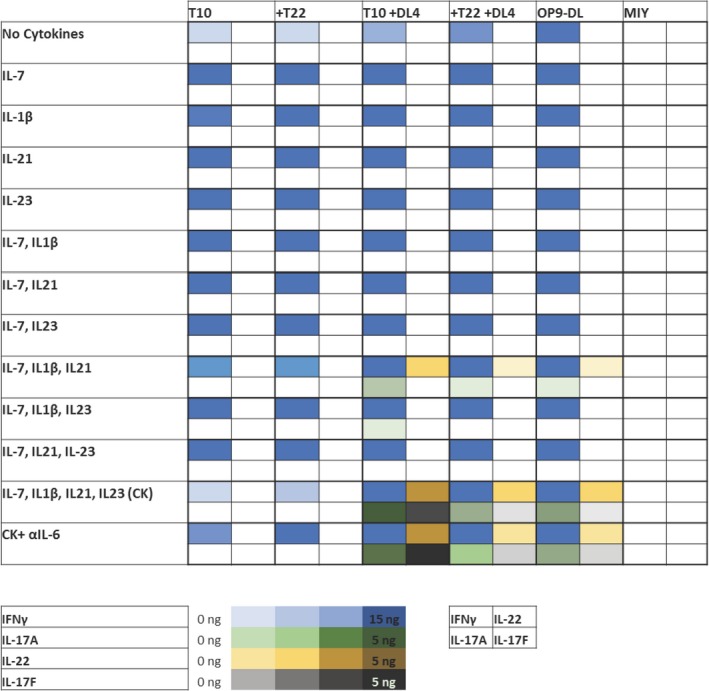
Figure 3.

Cytokine production profile of in vitro‐derived KN6 γδ T cells. Quantification of IFNγ, IL‐17A, IL‐17F and IL‐22 production by Day 4 sorted KN6 γδ T‐cells cultured as indicated. αIL‐6 denotes supplementation of co‐cultures with neutralizing antibodies for IL‐6 and IL‐6R. KN6 cells were stimulated with PMA/Ionomycin for 36 h and the cytokine concentrations in the supernatant were quantified by ELISA. This figure shows the mean cytokine levels expressed by KN6 cells from at least 3 separate experiments.
