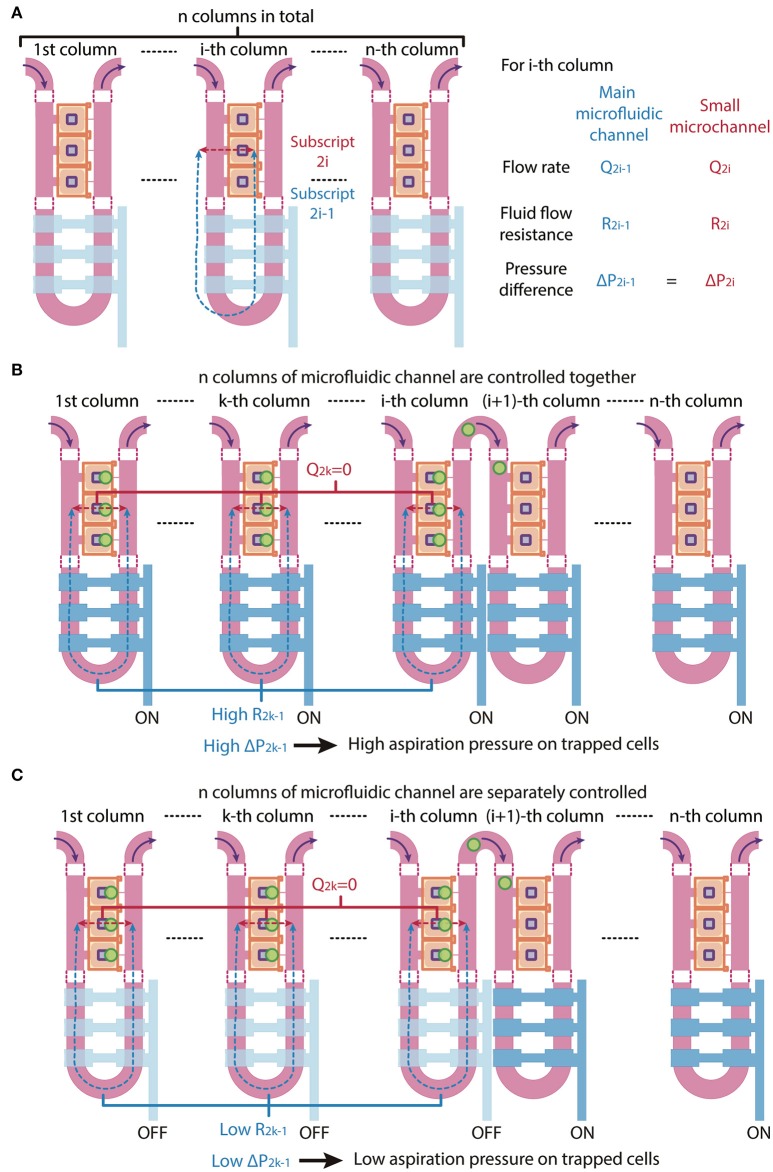
Figure 3.
Schematic of multi-column, separately-controlled cell trapping. (A) A schematic of a microfluidic channel with n individually controlled columns. Each column consists of two channels, so subscripts 2i and 2i-1 (with i = 1,2,3,…, n) address individual channels. Pressures (P), flow rates (Q), and resistances (R) of the main microfluidic channel and the small microchannel were denoted in blue and red and are shown in the figure as blue and red dotted lines, respectively. (B,C) A schematic of the same microfluidic channel when the n columns of microfluidic channel are (B) controlled altogether (i.e., all values are ON) or (C) separately controlled (i.e., valves 1 to i are OFF and valves i + 1 to n are ON). The consequential changes in fluid flow resistance and pressure difference across cells are shown.

