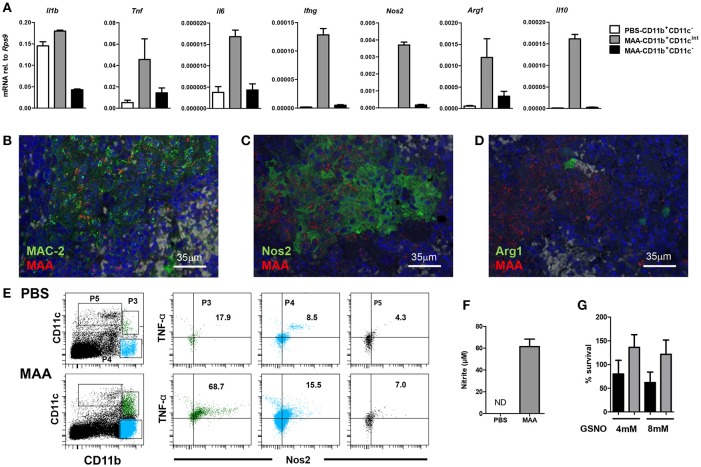
Figure 4.
Characterization of Gr-1intCD11bhiCD11cintM-MDSC from MAA-infected mice. (A) Spleen cell suspensions from mice 5 weeks post infection were FACS sorted based on the expression level of CD11b and CD11c markers. RNA was extracted and gene expression of the indicated genes was analyzed by qRT-PCR. Graphs show the amount of mRNA relative to that of Rps9. (B–D) Fluorescence-immunohistological pictures showing splenic expression of MAC-2 (B), Nos2 (C), and Arg1 (D) (all shown in green) in mice infected for 5 weeks with MAA (red). Nuclei are stained with DAPI (blue) and tissue autofluorescence is shown in gray. (E) Flow cytometry of spleen suspensions from MAA-infected mice showing the percentage of Nos2 and TNFα expressing cells among different myeloid cell subpopulations. (F) Nitrite production of splenocytes from MAA-infected mice determined by Griess reagent. (G) In vitro NO susceptibility of MAA and MAH. Percentage of survival of MAH (black bar) and MAA (gray bar) in the presence of GSNO for 4 h. Data shown [except E (one time with 4 mice per group)] is representative of at least two experiments with 3-5 mice per group, (mean ± SEM).

