Figure 5.
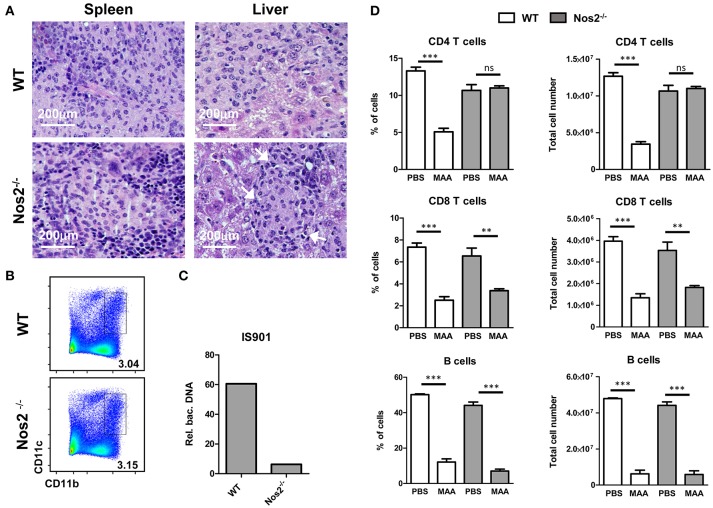
NO produced by Gr-1intCD11bhiCD11cint M-MDSC is responsible for CD4+ T cell ablation and disease control. (A) HE stained histology of spleen and liver from MAA-infected wt and Nos2−/− mice. Arrows indicate areas of lymphocytic cells. (B) FACS plots of spleen suspensions showing the percentage of M-MDSC like cells from MAA-infected wt and Nos2−/− mice. (C) Amount bacterial DNA in M-MDSC from MAA-infected wt and Nos2−/− mice determined as described in (Figure 3C). (D) Graphs showing the percentage (right) and the total number (left) of lymphocytes of spleens from MAA-infected wt and Nos2−/− mice 5 weeks pi. Data from 4 mice per group are shown. **p < 0.005, ***p < 0.001, t-test.

