Figure 6.
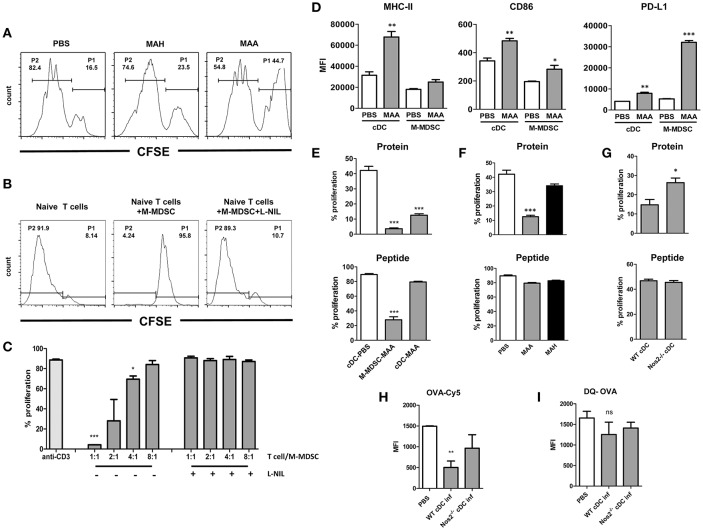
NO produced by Gr-1intCD11bhiCD11cintM-MDSC from MAA-infected mice affects CD4+ T cell response and cDC function ex vivo. (A) Anti-CD3 antibody mediated spleen CD4+ T proliferation from naïve (PBS control) and from mice infected with MAH or MAA for 33 days. CD4+ T cells from 5 mice in each group were isolated, pooled, CFSE labeled and cultured on anti-CD3 antibody coated cell culture microplates for 4 days. Histograms showing the percentage of non-proliferating cells (P1) and proliferating cells (P2). (B) CD11bhiCD11cint cells from spleens of MAA-infected mice were FACS sorted and co-cultured with CFSE labeled naïve CD4+ T cells in the presence of plate bound anti-CD3 antibody. T cell proliferation was measured after 4 days in culture by determining CFSE dilution. (C) Graph shows percentage of proliferation after incubating 3 × 10⁵ CD4+ T cells with decreasing numbers of M-MDSC in the presence or absence of Nos2 inhibitor, L-N6-(1-iminoethyl) lysine di-hydrochloride (L-NIL) at a final concentration of 40 μM. Data shows two independent experiments (mean ± SEM, *p < 0.05, ***p < 0.001). (D) Expression level of MHC-II, CD86, PD-L1 of conventional dendritic cells (cDC) and CD11bhiCD11cintcells (M-MDSC) from MAA-infected and PBS control mice determined by flow cytometry. MFI – mean fluorescent intensity (mean ± SEM, *p < 0.05, **p < 0.01, ***p < 0.001) from two independent experiments with 3-5 mice per group are shown. (E) M-MDSC and cDC from MAA-infected and control mice (PBS) were sorted from spleen suspensions and pulsed with ovalbumin protein (100 μg/ml) or ovalbumin peptide 323-339 (1 μg/ml) for 1 h at 37°C. Subsequently, they were incubated with CFSE labeled splenic CD4+ T cells isolated from OT-II mice. After 3 to 4 days, proliferation of T cells was measured by flow cytometry. Graphs show the percentage of T cell proliferation stimulated by OVA protein (top) or OVA peptide (bottom). (F) Percentage of T cell proliferation induced by cDC from MAA or MAH-infected mice or control mice (PBS) analyzed as described in (E). (G) T cell proliferation induced by cDC from MAA-infected wt and Nos2−/− mice analyzed as described in (E). (H,I) Uptake and processing of protein antigen by cDC. (H) cDC from control and infected mice were exposed to Cy5 conjugated OVA for 1.5 h and the amount of internalized antigen was determined by flow cytometry. (I) Degradation of internalized was determined using DQ OVA. As fluorescence is quenched on intact DQ-OVA, only degraded OVA can be determined by flow cytometry. Results from 3-5 mice were included per group and three independent experiments performed (mean ± SEM, *p < 0.05, ***p < 0.001).

