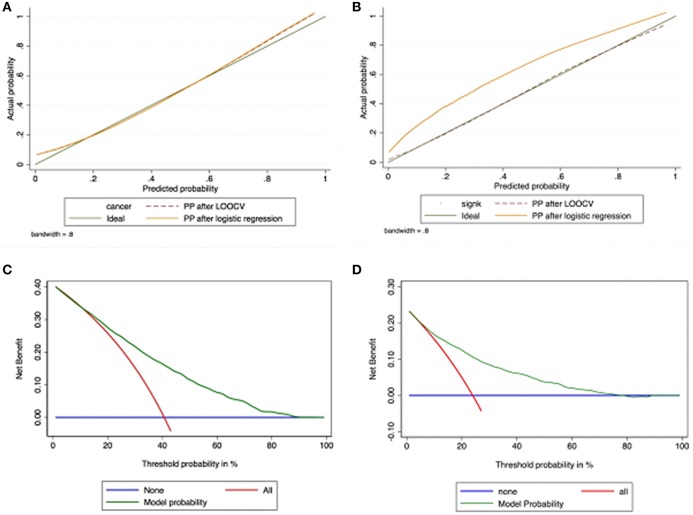
Figure 3.
Calibration plot of observed vs. predicted probabilityof PCa (A) and CSPCa (B) after leave-one-out cross validation, demonstrating excellent concordance. Decision curve analyses demonstrating net benefit between the threshold probabilities of ~15 and ~80% for the model predicting PCa (C) and between the threshold probabilities of ~10 and ~60% for the model predicting CSPCA (D).

