
Figure 1.
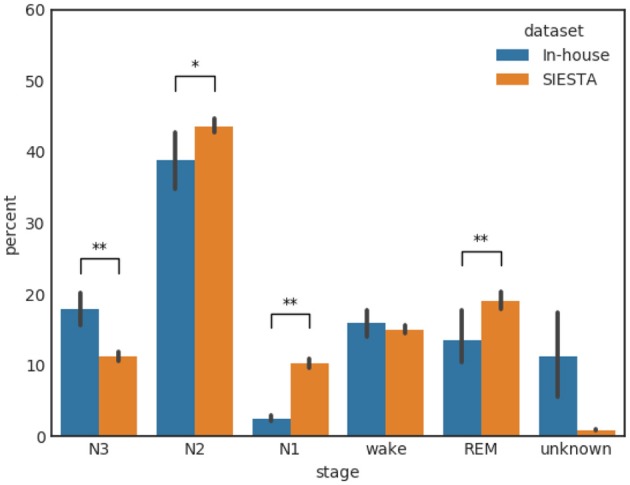
Distribution of the annotated sleep stages for the in-house database and the SIESTA database. The variance bars indicate the per-subject variance. The symbols “*” and “**” indicate a p-value of a Wilcoxon rank-sum test of < 0.05 and < 0.01, respectively.