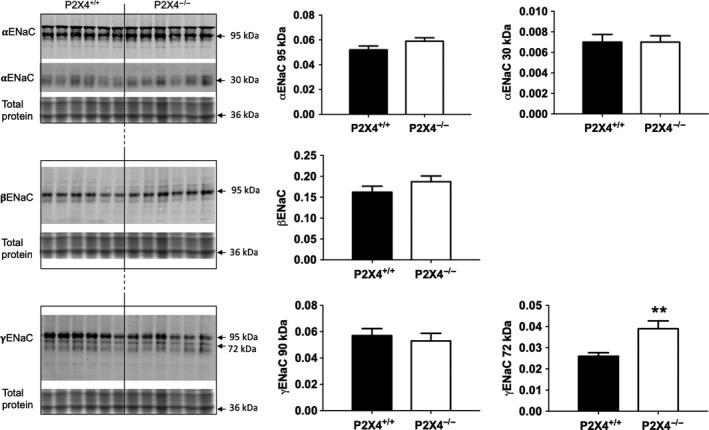
Figure 3.

Protein abundance of ENaC subunits by Western blot analysis in P2X4+/+ (■) and P2X4−/− (□) mice on a low Na+ diet for 14 days (n = 6 for both). Analysis of signals was performed with an infrared‐based imaging system. Data are mean ± SEM, and comparisons were made using t‐test. **P < 0.01.
