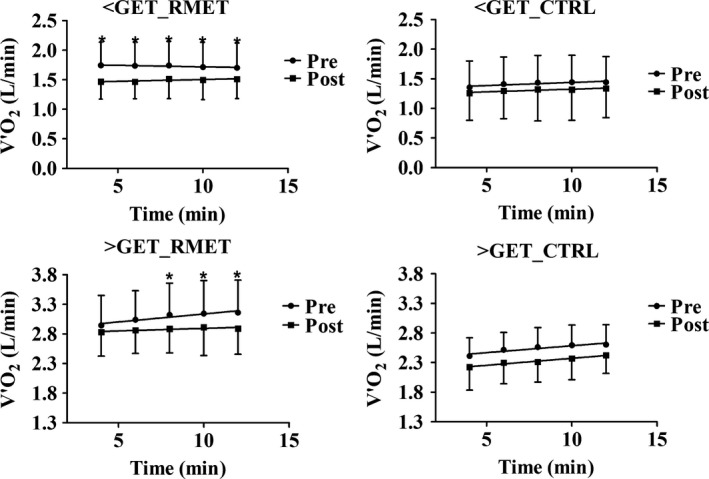
Figure 2.

Mean (±SD) O2 values calculated every 2 min, from the third to the last minute of CWR walking at ~60% of GET (moderate‐intensity, upper panels) and at ~120% of GET (heavy‐intensity, lower panels), before and after RMET and CTRL. During CWR <GET mean values of the individual slopes of the linear regressions of O2 versus time were not significantly different from zero, before and after both interventions. At all‐time points O2 values were significantly lower after versus before RMET, whereas no statistically significant differences were observed after versus before CTRL. During CWR >GET the slopes of the linear regressions of O2 versus time were significantly greater than zero before both RMET and CTRL. The mean values of the individual slopes were significantly lower after versus before RMET, but not after versus before CTRL. See text for further details. *P < 0.05. CWR, constant work rate; GET, gas exchange threshold; RMET, respiratory muscle endurance training.
