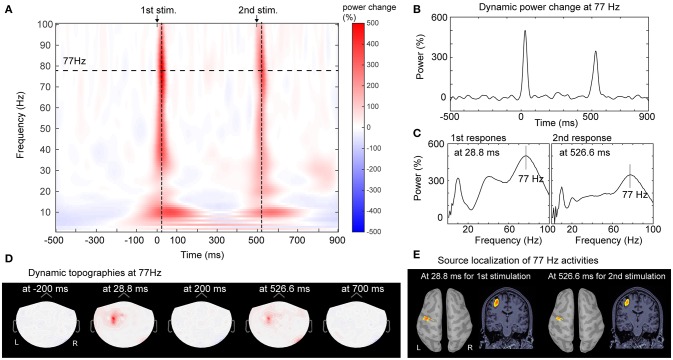
Figure 1.
Analysis of gamma oscillations of SEF responses. The time-frequency representation of cortical activities from one channel in response of paired-pulse electrical stimulation from Control No. 1 was shown as the example. (A) Prominent power increase was observed after the first and second electric stimulations, especially at the frequency bands of 5~20 Hz and 30~100 Hz. In the frequency range of gamma oscillation, the peak frequency was 77 Hz for both responses. (B) The time-varying dynamic power change of the peak gamma activities (at 77 Hz) in the time window of−500~900 ms (long-dashed line in 1A) exhibited the peak latencies at 28.8 and 526.6 ms for first and second response respectively. (C) The power spectrums of the maximal power increase located at 77 Hz for both the first and second stimulation. (D) The topographic distributions of peak gamma oscillation showed the temporal-dynamic and spatial-specific cortical activation. Synchronized gamma increase was elicited contralaterally and locally. (E) Localization of gamma oscillation at peak frequencies and latencies for the first and second stimulations were mapped onto the primary somatosensory area on the reconstructed cortical surface of brain. MRI. L, left; R, right; 1st, the first; 2nd, the second.

