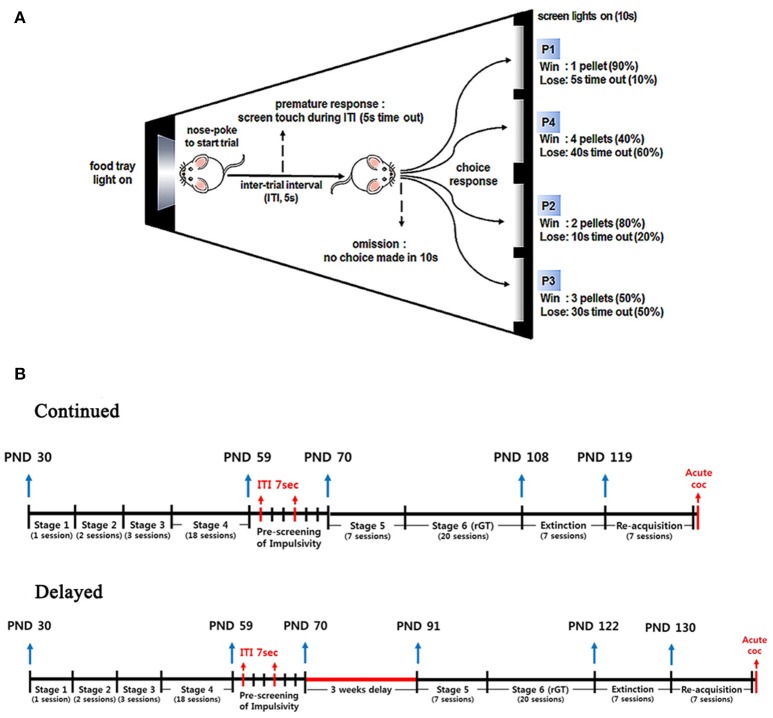
Figure 1.
Schematic diagram for the rGT chamber and time lines for the whole experimental procedures. (A) Schematic diagram of the rGT chamber, where a food magazine unit (left) and 4 response windows (right) are shown. Each window is represented as P1 through P4 with a different number of pellets, duration of time-out, and frequencies. (B) Time lines for the whole experimental procedures were illustrated with rat's age indicated. A single session can be added to the age as 1 day. Note that there were days with no experiments conducted during the weekends.

