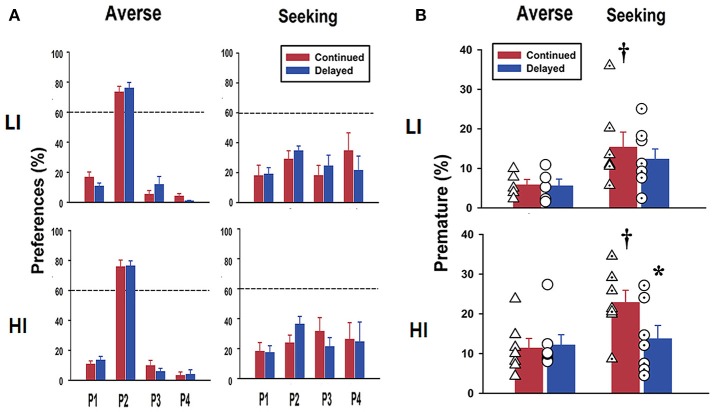
Figure 3.
Basal scores for risk preference and premature response scores after rGT. (A) Data obtained after rGT training clearly show different risk preferences between the groups. The risk-averse group overwhelmingly chose P2 over the other windows more than 60% of the choices, whereas the risk-seeking group chose P2 <60% of the choices. There were no significant differences between LI and HI groups. The continued group also made no differences when compared to the delayed group. (B) Premature response scores obtained after rGT show that the HI group had higher scores than the LI group, and it was the same for the risk-seeking group compared to the risk-averse group. Within the same risk-seeking group, the continued group had significantly higher increased scores for premature response than those in the delayed group, only in pre-categorized as the HI group. Values are expressed as a mean+standard error of mean. *p < 0.05; compared to continued group within risk-seeking. †p < 0.05; compared to risk-averse within the continued group. Individual scores are shown as symbols (triangles and circles for continued and delayed group, respectively) overlaid on top of the bar graph.

