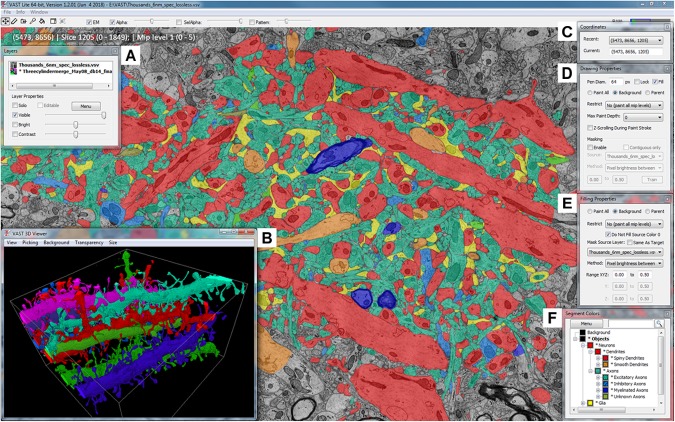
FIGURE 1.
The Volume Annotation and Segmentation Tool (VAST) user interface. The main window of VAST shows an EM dataset with a manual segmentation layer as transparent overlay in which segments are colored by type (colors of collapsed folders in the “Segment Colors” tool window). The “3D Viewer” window (B) shows spiny dendrites in the area in individual colors. The tool windows A and C–F are explained further in section 2 of the main text.

