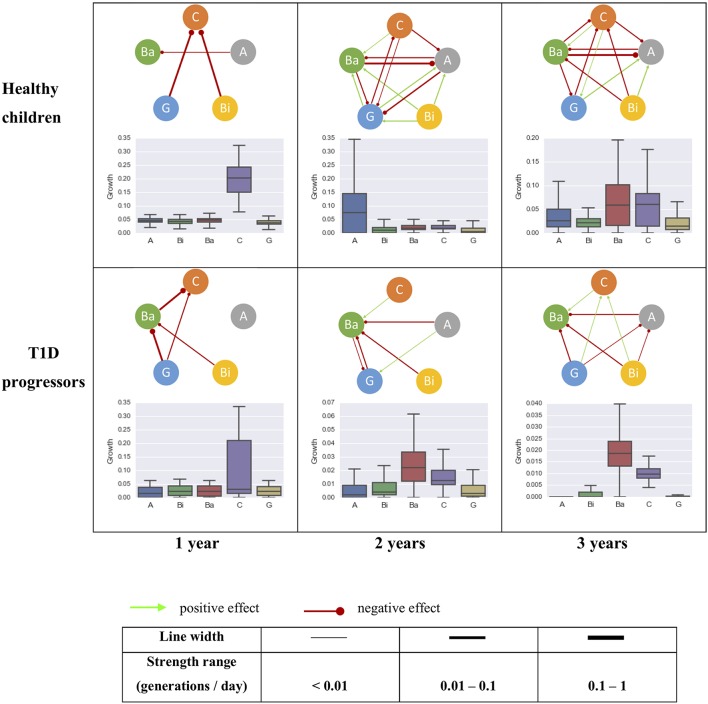
Figure 4.
The intrinsic growth rates of five most abundant bacterial classes and their interactions within the gut microbiome community of healthy (top row, control) and T1D progressors (bottom row, case) at 0–1 year (left column), 0–2 years (mid column), and 0–3 years (right column) of age. The line thickness is proportional to the strength of the interaction. A, Actinobacteria; Bi, Bacilli; Ba, Bacteroidia; C, Clostridia; G, Gammaproteobacteria.

