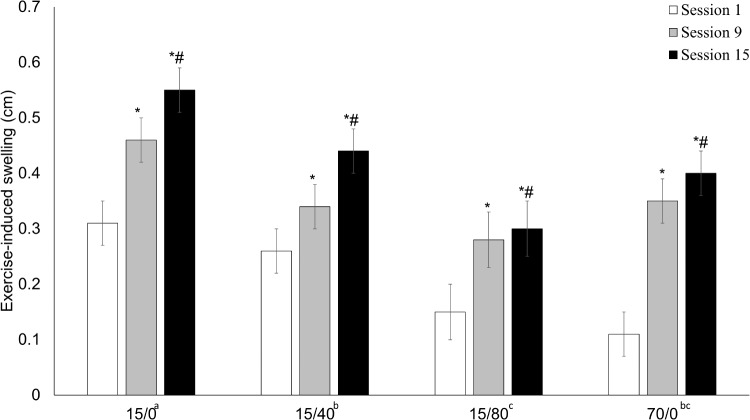
FIGURE 6.
Exercise-induced swelling response. The exercise-induced swelling response to session 1, session 9, and session 15. Data presented as mean (SE). An ∗ indicates a significant difference from session 1, whereas # indicates a significant difference from session 9. Letters next to condition labels indicate significant differences (main effect of condition). If conditions share the same letter they are not different from one another. Alpha level = 0.05.

