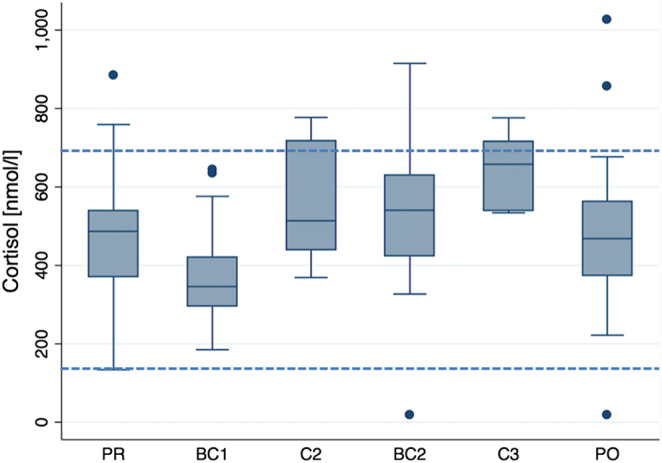
Figure 1.

Cortisol concentration (nmol/L), representing a stress axis. Effect of altitude at 550 m before the expedition (PR), during ascent at 4.844 m (BC1), 6.022 m (C2) and 7.050 m altitude (C3), during descent at 4.822 m after acclimatization (BC2) and after the expedition at 550 m (P0). Boxes represent the 25th and 75th percentiles, and the bottom and top whiskers are defined by the 25th percentile minus 1.5 times the interquartile range (IQR) and the 75th percentile plus 1.5 times the IQR, respectively. Data points outside this range are plotted as individual points. Horizontal lines represent normal values. Statistical comparisons are shown in Tables 2 and 10.

 This work is licensed under a