Figure 2.

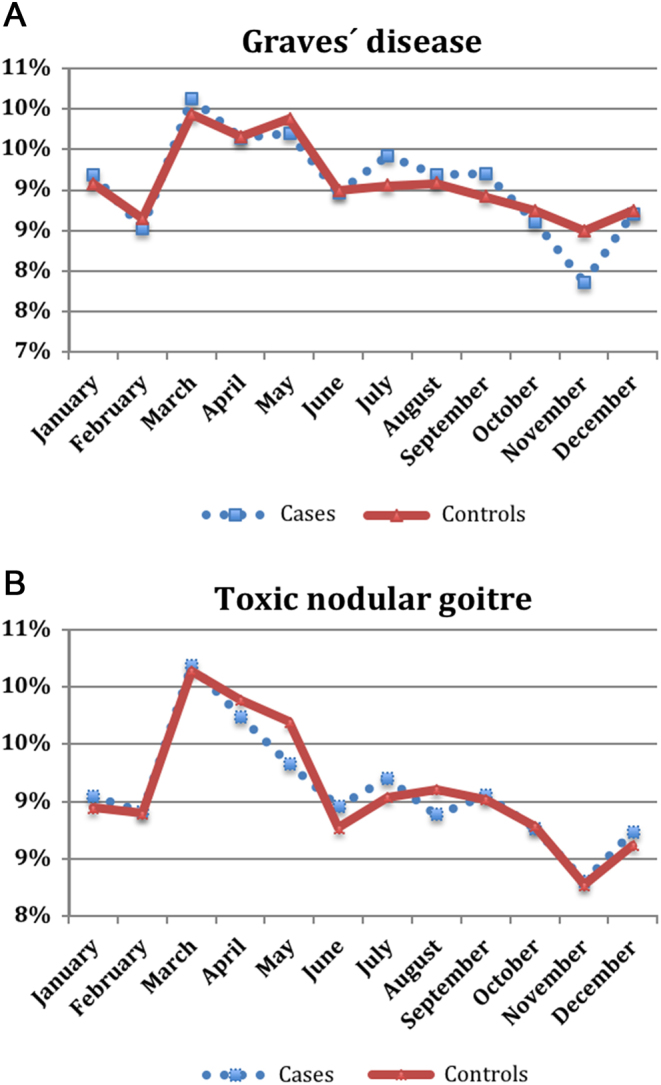
Distribution of month of birth among cases with Graves´ disease (A) and toxic nodular goitre (B), respectively, and controls. Walter–Elwood test, P value = 0.052 and 0.53 for Graves´ disease and toxic nodular goitre, respectively.

Distribution of month of birth among cases with Graves´ disease (A) and toxic nodular goitre (B), respectively, and controls. Walter–Elwood test, P value = 0.052 and 0.53 for Graves´ disease and toxic nodular goitre, respectively.