
Figure 3.
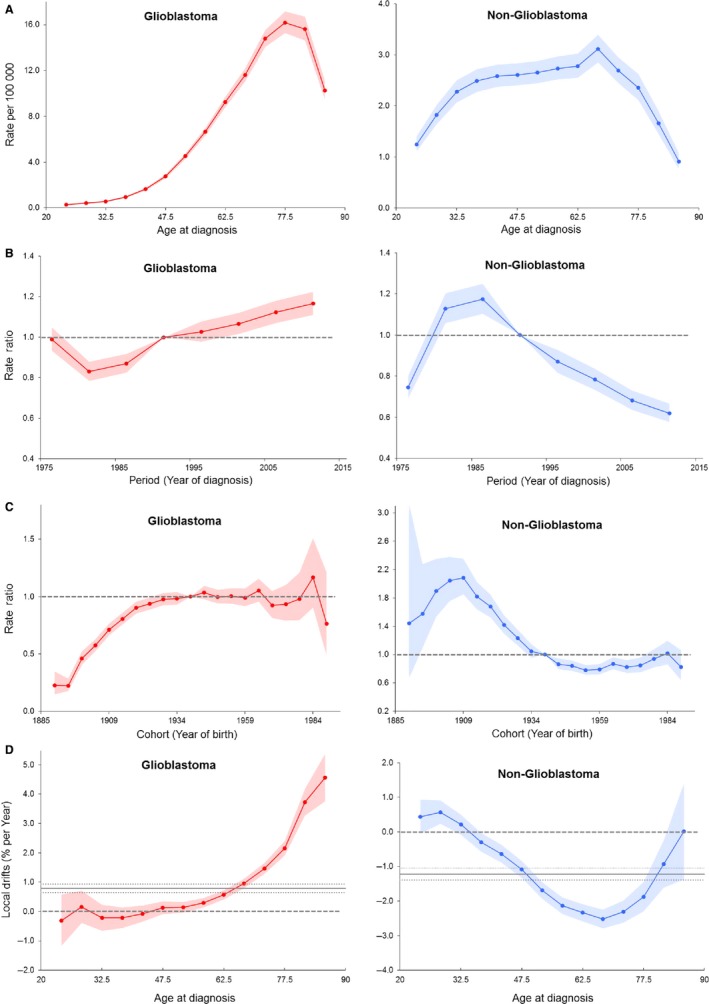
Age‐period‐cohort modeling parameters and functions for incidence for glioblastoma (left) and nonglioblastoma (right). (A) Period rate ratio (B) cohort rate ratio (C) longitudinal age curve, and (D) local drifts with net drift. Shaded bands indicate 95% confidence intervals. Dash lines in (A) and (B) indicate reference period and cohort, respectively. Solid horizontal line and upper and lower dot lines in (D) indicate net drift and its 95% confidence intervals