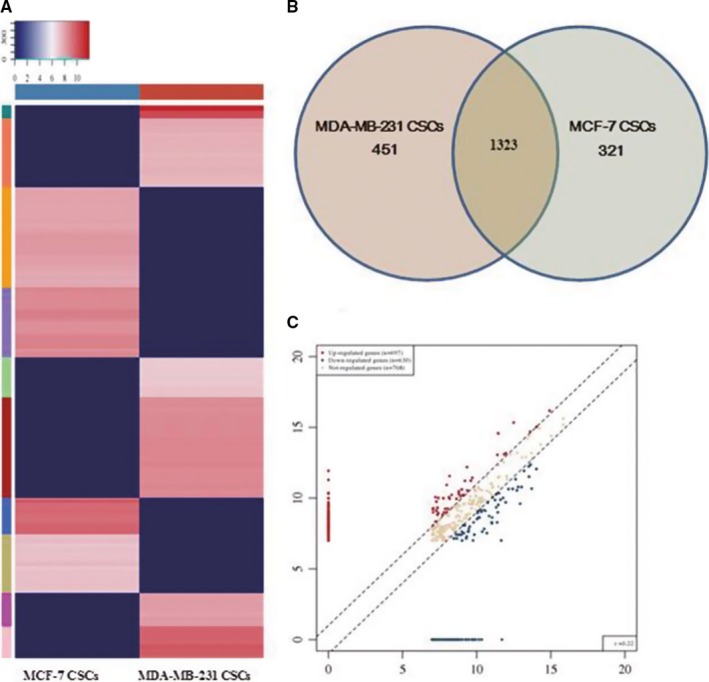
Figure 3.

Differentially expressed tDRs between MDA‐MB‐231 and MCF‐7 CSCs. A, Heatmaps of differentially expressed tDRs in MDA‐MB‐231 and MCF‐7 CSCs. B, The gene number which expressed in the two groups and the specific expressed in each group. C, Scatter plot of differentially expressed tRFs&tiRNAs: Genes above the top line showed upregulation, and genes below the bottom line represented downregulation; gray dots indicated genes without differentially expression
