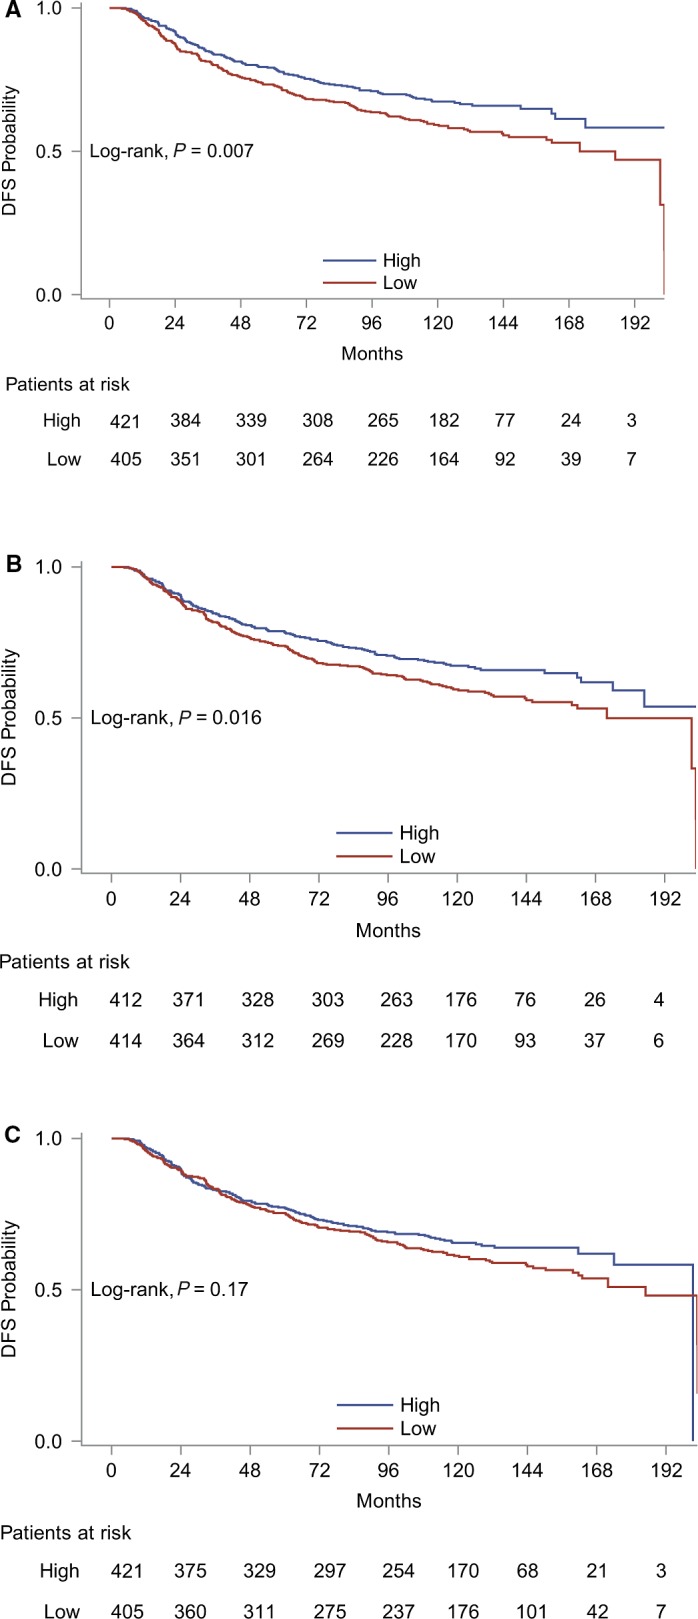
Figure 6.

Kaplan–Meier curves for CD3 (A), CD8 (B), and FOXP3 (C) mRNA expression (using the median as a cutoff point) with respect to DFS

Kaplan–Meier curves for CD3 (A), CD8 (B), and FOXP3 (C) mRNA expression (using the median as a cutoff point) with respect to DFS