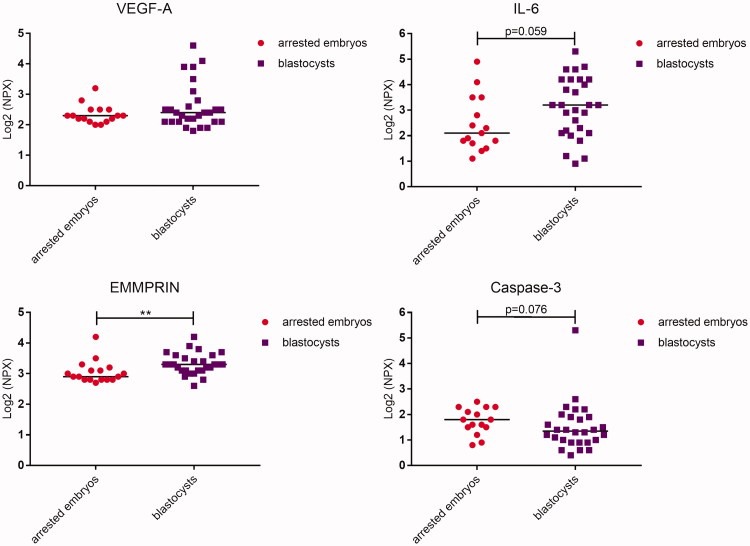
Figure 1.
Dot plot showing median protein levels detected in culture media from human embryos developing into blastocysts or that arrested. Each dot represents the level of the respective protein from each embryo. Comparison between the groups was determined by using the Mann–Whitney U test. NPX = normalized protein expression.

