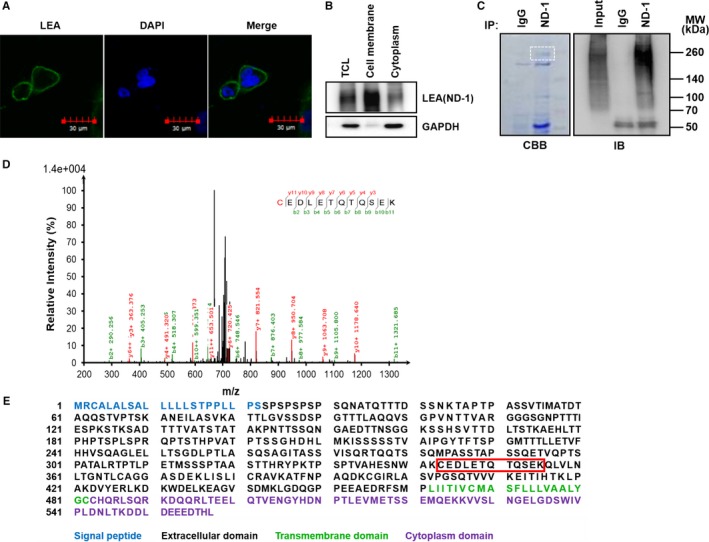
Figure 1.

Identification of LEA as a PODXL protein in CL187 cells. A, Analyzing the cellular localization of LEA by immunofluorescence method with FITC‐labeled ND‐1. Scale bars: 30 μm. B, Analyzing the cellular distribution of LEA by western blotting. GAPDH was used as internal control of cytoplasmic protein. C, Analysis of the LEA immunoprecipitated by ND‐1 using SDS‐PAGE (left) and western blotting (right). The band of interest in white dashed box is cut off for MS analysis. D, The ion fragment spectrum of ND‐1‐immunoprecipitates by LC‐MS/MS analysis. E, Primary structure of PODXL. The peptide sequence identified by MS is shown in red box. TCL, total cell lysate; CBB, coomassie brilliant blue staining; IB, immunoblotting; MW, molecular weight
