Figure 4.

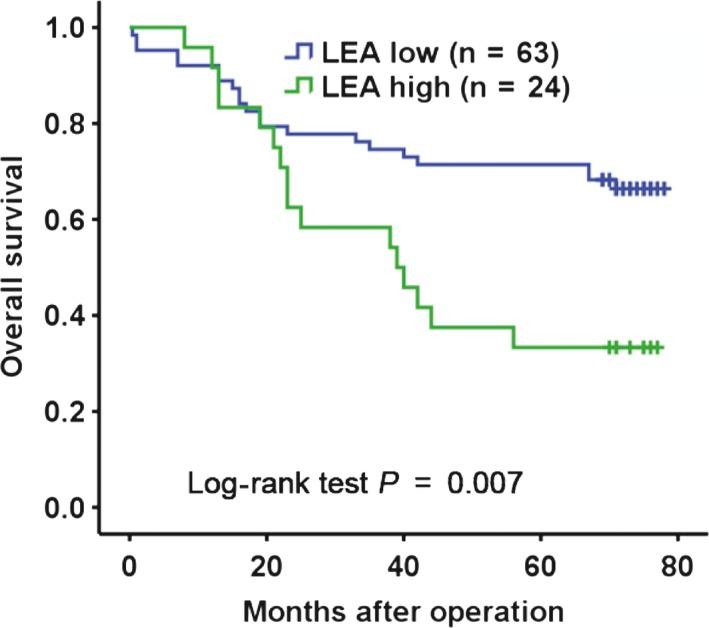
Kaplan‐Meier analysis of the association between LEA/PODXL expressions and OS of CRC patients. LEA low: LEA negative/low/moderate expression; LEA high: LEA strong expression

Kaplan‐Meier analysis of the association between LEA/PODXL expressions and OS of CRC patients. LEA low: LEA negative/low/moderate expression; LEA high: LEA strong expression