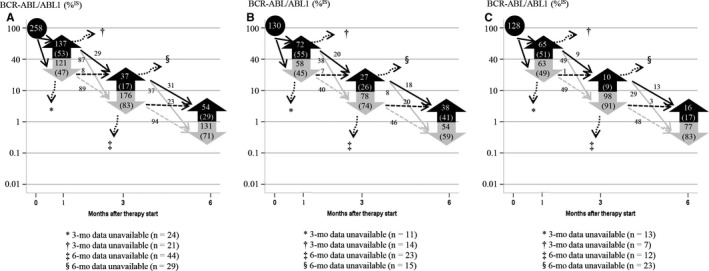
Figure 2.

Subsequent change in molecular response. A, total patients; B, imatinib‐treated patients; C, 2G TKI‐treated patients; N (%)

Subsequent change in molecular response. A, total patients; B, imatinib‐treated patients; C, 2G TKI‐treated patients; N (%)