
Figure 2.
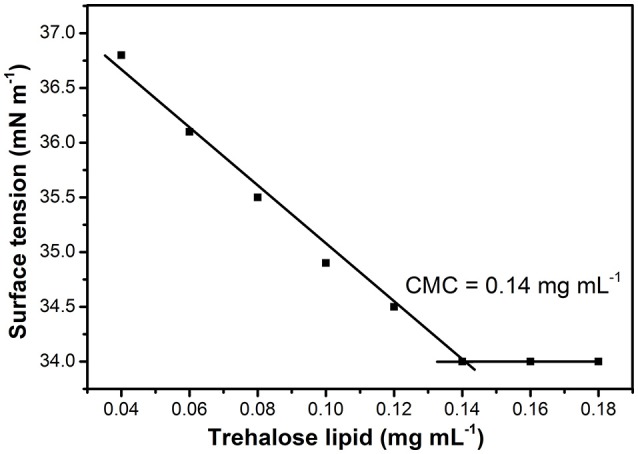
Effect of trehalose lipid concentration on surface tension. The CMC was determined from the intersection of regression lines that describe two parts of the curve, below and above the CMC.
Official websites use .gov
A
.gov website belongs to an official
government organization in the United States.
Secure .gov websites use HTTPS
A lock (
) or https:// means you've safely
connected to the .gov website. Share sensitive
information only on official, secure websites.
Effect of trehalose lipid concentration on surface tension. The CMC was determined from the intersection of regression lines that describe two parts of the curve, below and above the CMC.