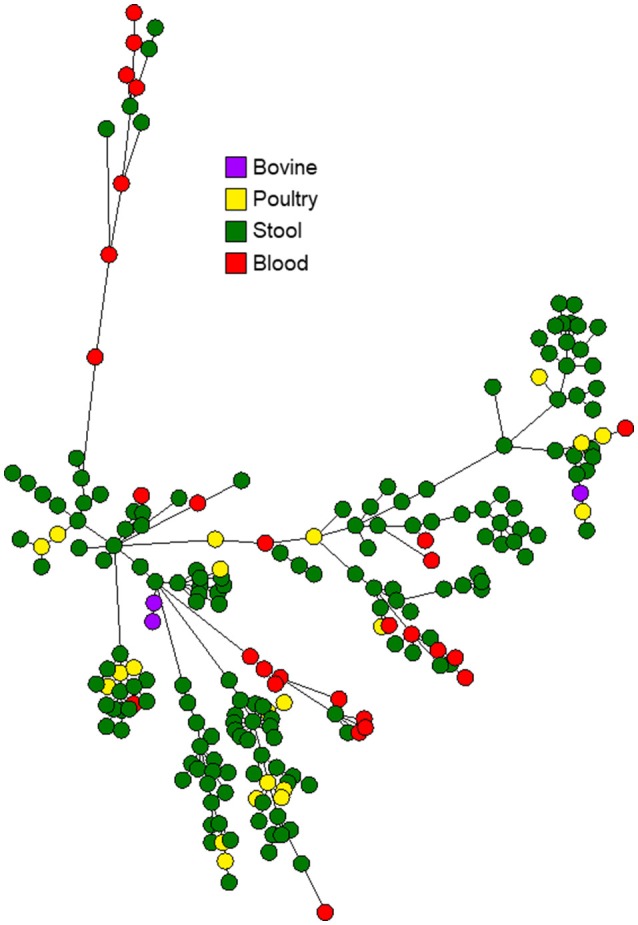
Figure 3.

Phylogenetic analysis of C. jejuni isolates from the six leading clonal complexes in Israel during 2003–2012. The minimum spanning trees are based on wgMLST analyses of 192 clinical and 24 veterinary isolates. Isolates are represented by circles connected by branches proportional to the allelic distance. Colors represent isolation source.
