Figure 5.

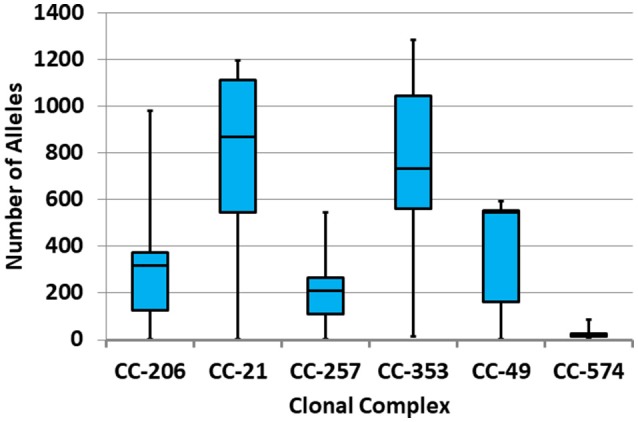
Distribution of allelic distances within the six leading clonal complexes. The distribution of allelic differences between each pair of isolates is presented in a box-whisker plot.

Distribution of allelic distances within the six leading clonal complexes. The distribution of allelic differences between each pair of isolates is presented in a box-whisker plot.