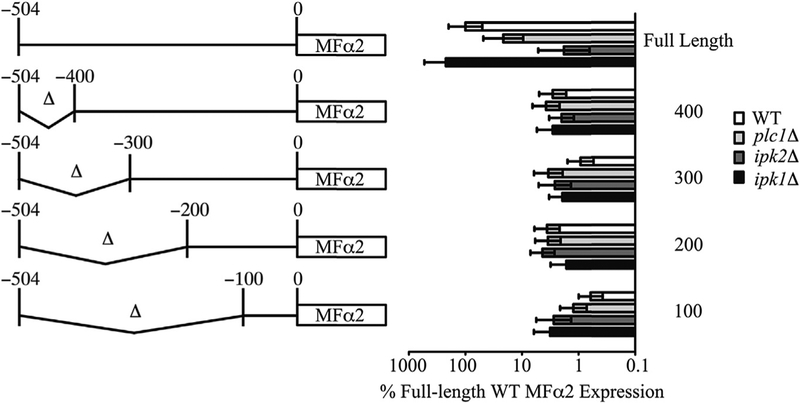
Fig. 4. Truncation of the MFα2 promoter identifies an essential regulatory region.
At left is a schematic showing promoter truncation mutants and the corresponding naming convention. The coordinates are indicated relative to the start codon of MFα2. The graph on the right shows real-time PCR quantification of MFα2 expression levels in the promoter truncation mutants. Values are the mean ± SD of at least 3 independent cultures.

