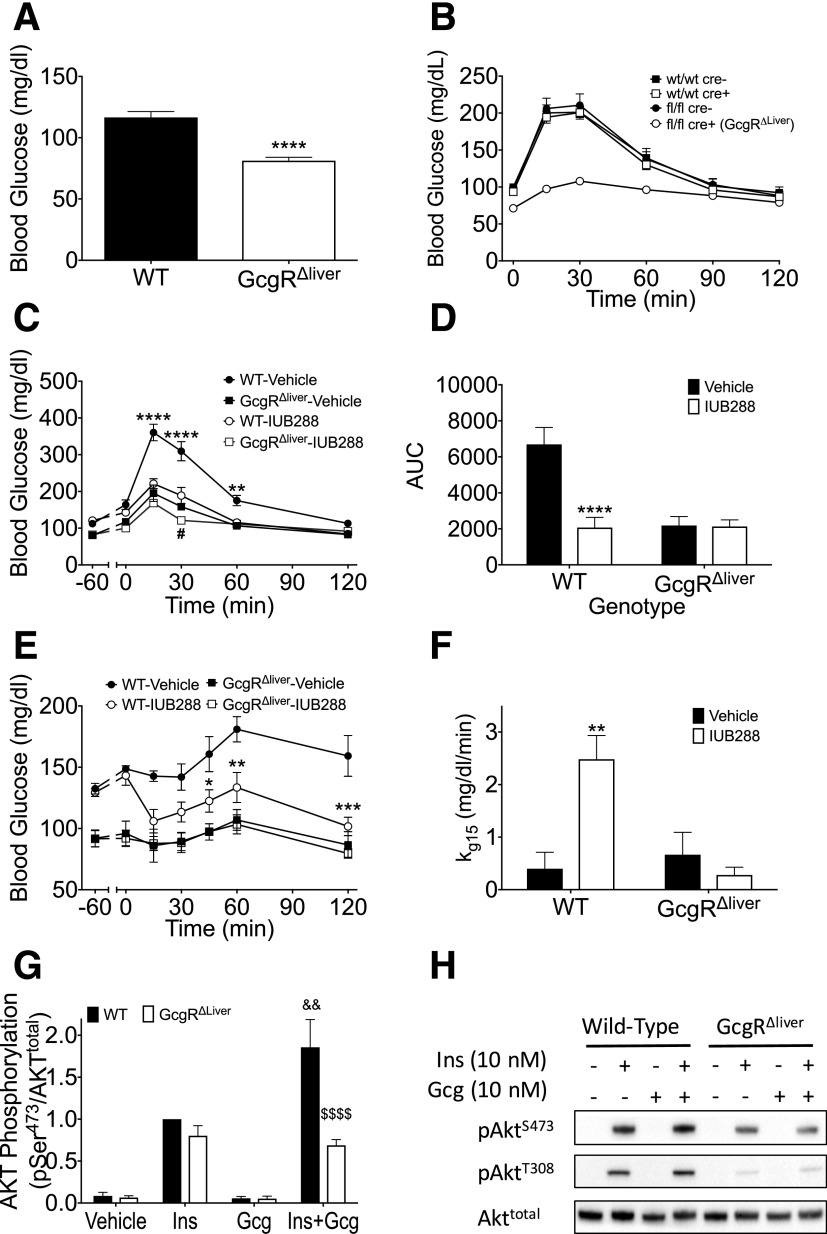
Figure 6.
Hepatic receptors contribute to GCGR-mediated improvements in insulin action. Fasting blood glucose (A) and i.p. IUB288-stimulated blood glucose excursion (B) in WT and Gcgr∆liver mice. GTT (C) and AUC analysis (D) in WT and Gcgr∆liver mice with IUB288 pretreatment. ITT (E) and kg 15 analysis (F) in WT and Gcgr∆liver mice with 60-min IUB288 pretreatment administered s.c. at 10 nmol/kg throughout. Immunoblot analysis of AKT phosphorylation in response to insulin and GCG cotreatment in hepatocytes isolated from WT or Gcgr∆liver mice (G and H). All data are represented as mean ± SEM. *P < 0.05, **P < 0.01, ***P < 0.001, and ****P < 0.0001, WT vehicle vs. WT IUB288; #P < 0.05, Gcgr∆liver vehicle vs. Gcgr∆liver IUB288; &&P < 0.01, WT insulin vs. WT insulin + IUB288; $$$$P < 0.0001, WT insulin + IUB288 vs. Gcgr∆liver insulin + IUB288.

