Figure 1.
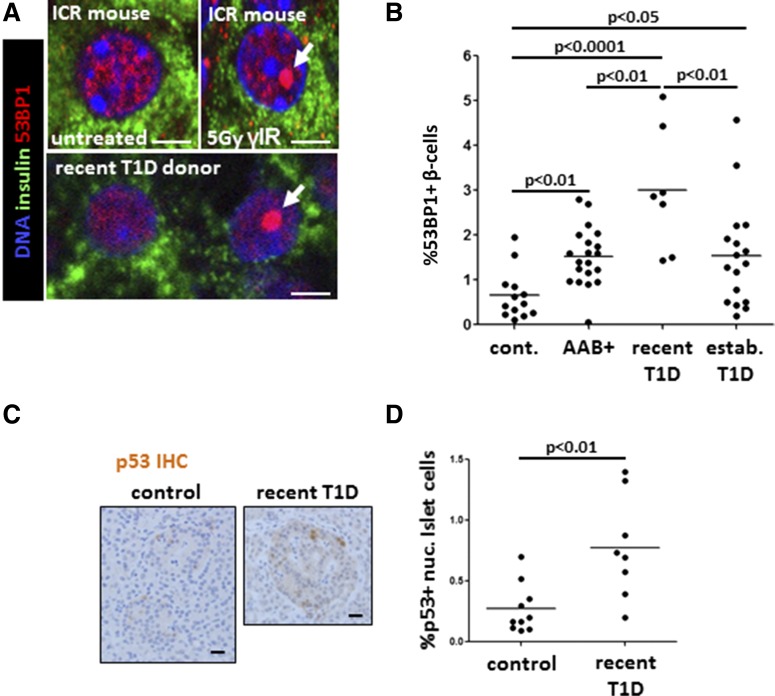
DDR in β-cells of patients with recently diagnosed T1D. A: Immunofluorescent staining of 53BP1 in β-cells in vivo. The top panel shows the pattern of nuclear 53BP1 in β-cells (stained for insulin) of wild-type mice, untreated or 8 h after sublethal γ-irradiation (γIR). Note the typical accumulation of a large, single nuclear focus of 53BP1 in irradiated mice (arrow). The bottom panel shows two adjacent β-cells from patients with recently diagnosed T1D, with the normal or DNA damage typical pattern of nuclear 53BP1 (arrow). Scale bars = 2 μm. B: The fraction of β-cells with activated 53BP1 in healthy donors (cont.) (n = 12), people at risk for T1D (AAB+, n = 20), patients with recently diagnosed T1D (n = 7), and patients with established T1D (n = 18). Each dot represents an individual person. C: Representative images from immunostaining for p53 in islets of health donors and patients recently diagnosed with T1D. Nuclear accumulation of signal signifies p53 activation. Scale bars = 20 μm. D: Quantification of nuclear (nuc.) p53 in islets from healthy donors (n = 10) and patients with recently diagnosed T1D (n = 7). Each dot represents an individual person. IHC, immunohistochemistry.

