Figure 3.
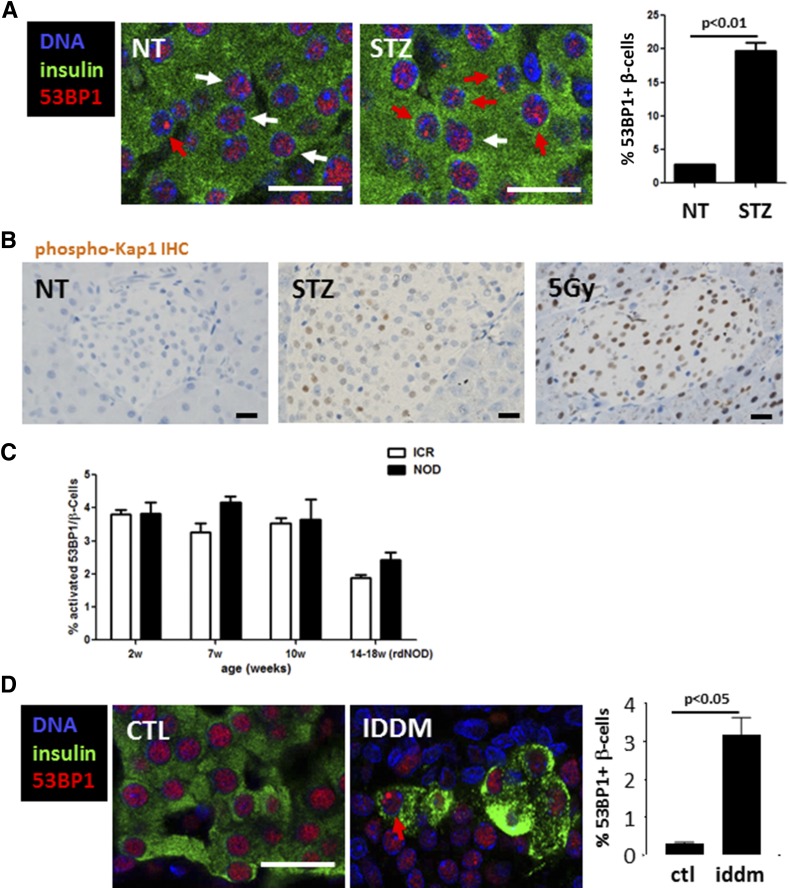
DDR in rodent models of diabetes. A: Immunostaining for 53BP1 in mouse β-cells in vivo after a single dose of 30 mg/kg STZ to wild-type mice. White and red arrows mark nuclei with nonactivated or activated 53BP1, respectively. Scale bars = 20 μm. Also shown is the quantification of the percentage of β-cell nuclei with nuclear 53BP1 foci. Untreated, n = 2 (NT); STZ (40 mg/kg) injected, n = 3. Error bars represent 1 SEM. B: Representative images from immunostaining for phospho-Kap1 in islets of control, single acute STZ-injected (200 mg/kg), and 5-Gy–irradiated mice. Nuclear accumulation of signal signifies Kap1 phosphorylation. Scale bars = 20 μm. C: Quantification of 53BP1 nuclear foci in islets of NOD and ICR control mice at various ages. D: Immunostaining for 53BP1 in healthy control (CTL) rats and in prediabetic LEW.1AR1-iddm rats and quantification of the 53BP1 nuclear foci in β-cells. Scale bar = 20 μm. IHC, immunohistochemistry; rdNOD, recently diagnosed nonobese diabetic mice; w, weeks.

