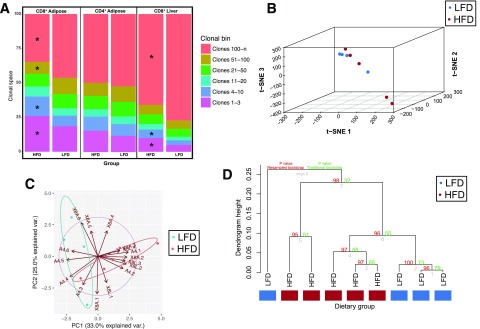
Figure 2.
Clonal homeostatic space differs between dietary groups and is a distinctive signature in multidimensional space. A: The space within the repertoire occupied by the clonotypes within each clonal bin was calculated for each mouse. The geometric mean for each of these proportions was calculated for each diet group, and the clonal homeostatic proportions occupied were tested using the two-tailed Mann-Whitney U test. The clonal proportions distinguish between dietary conditions using modern machine learning methods measuring several multidimensional distances. B: Two dimensional t-SNE projection of clonal homeostatic proportions from the AT reveals that lean and obese mice differ in clonal homeostasis as measured in a two-dimensional projection. PCA with centering and scaling was performed before t-SNE, and 15 dimensions were retained for embedding with the t-SNE algorithm. C: PCA projection of clonal homeostatic proportions reveals that the repertoire space occupied by both highly and lowly abundant clonotypes distinguishes between lean and obese mice. D: Hierarchical clustering using average linkage and absolute correlation reveals that clonal homeostatic proportions distinguish between lean and obese mice. Values shown at each node demonstrate the confidence that a cluster truly exists as measured using multiscale bootstrap resampling and traditional bootstrapping. Multiscale bootstrap resampling validates that these characteristic differences are not expected to distinguish between lean and obese mice by chance alone. *P ≤ 0.05. PC, principal component; var., variance.

