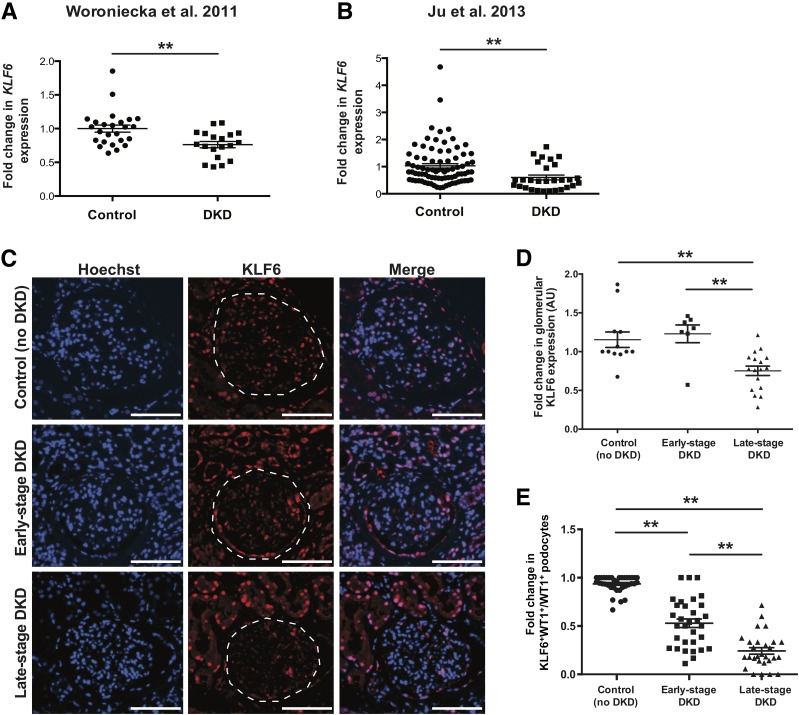
Figure 7.
Reduced KLF6 expression in human kidney biopsies with fibrosis. A and B: Previously reported gene expression arrays from Woroniecka et al. (42) and Ju et al. (43) were used to examine KLF6 expression in RNA from microdissected glomerular compartments of kidney biopsies with DKD as compared with healthy living donor nephrectomies (**P < 0.01, unpaired t test). C: Immunostaining for KLF6 and Hoechst was performed in kidney biopsies with early-stage DKD (n = 7) and late-stage DKD (n = 17) and in control specimens (n = 12), and representative images are shown. Dashed white line was traced to show the glomerular region. Scale bars = 100 μm. D: ImageJ was used to quantify the intensity of KLF6 expression in all three groups. E: To determine podocyte-specific expression of KLF6, immunostaining for KLF6 and WT1 was performed, and each glomerulus was selected and quantified for KLF6 staining in the podocytes as a ratio of KLF6+WT1+ cells to WT1+ cells. **P < 0.01, Kruskal-Wallis test with Dunn posttest. AU, arbitrary units.

