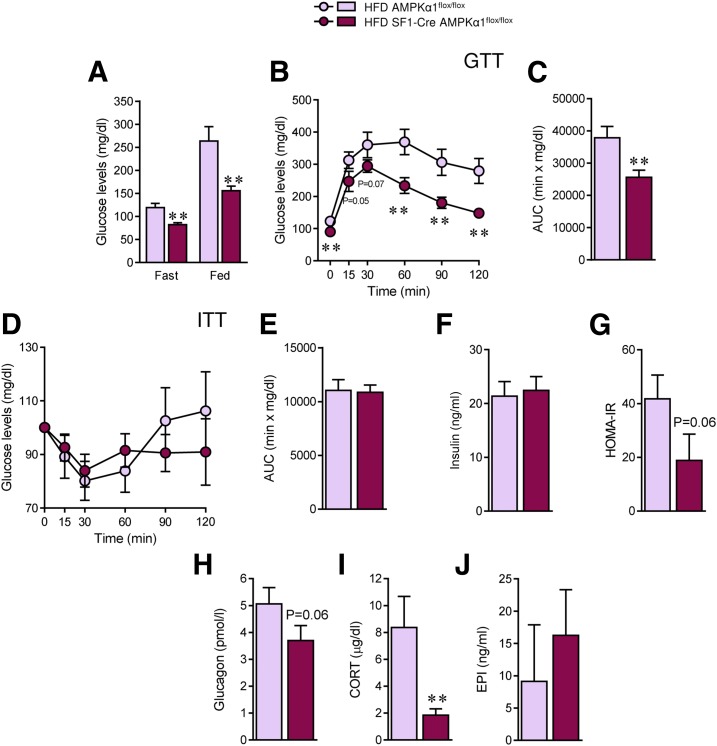
Figure 7.
Effect of deleting AMPKα1 in SF1 neurons on glucose homeostasis in HFD-induced obese mice. A: Fast and fed plasma glucose levels (n = 9–11 mice/group). B and C: Glucose tolerance test and AUC (n = 10–11mice/group). D and E: Insulin tolerance test and AUC (n = 10–11 mice/group). F: Plasma insulin levels (n = 9 mice/group). G: HOMA-IR index (n = 5 mice/group). H: Glucagon fasting levels (n = 5 mice/group). I: CORT fasting levels (n = 5 mice/group). J: Epinephrine fasting levels (n = 5–6 mice/group). **P < 0.01 vs. HFD AMPKα1flox/flox. Statistical significance was determined by Student t test. Data are expressed as mean ± SEM. EPI, epinephrine.

