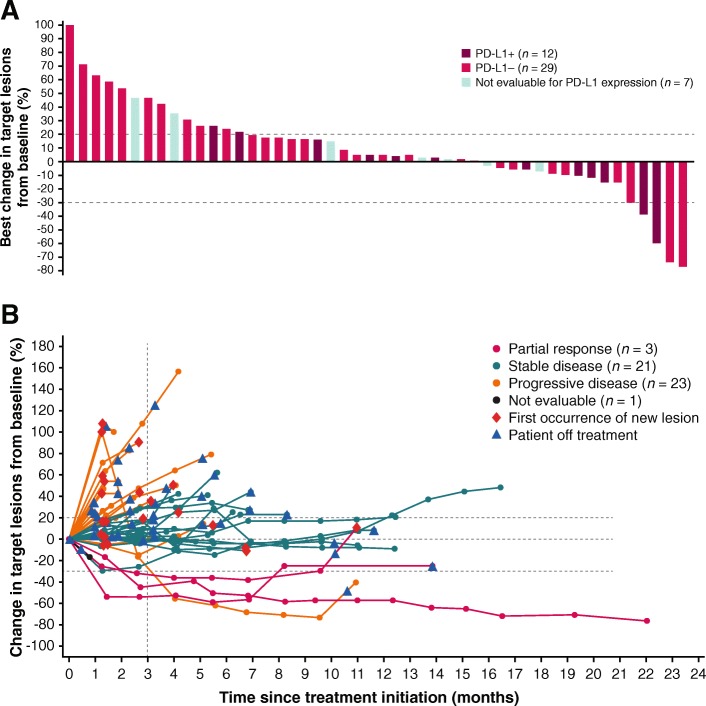
Fig. 2.
a Best change and b change over time from baseline in sum of target lesion diameters in evaluable patients (n = 48). In a bars for individual patients are color-coded according to tumor PD-L1 status based on a 5% PD-L1 expression cutoff in tumor cells. In b lines for individual patients are color-coded based on confirmed best overall response

