Fig. 2.

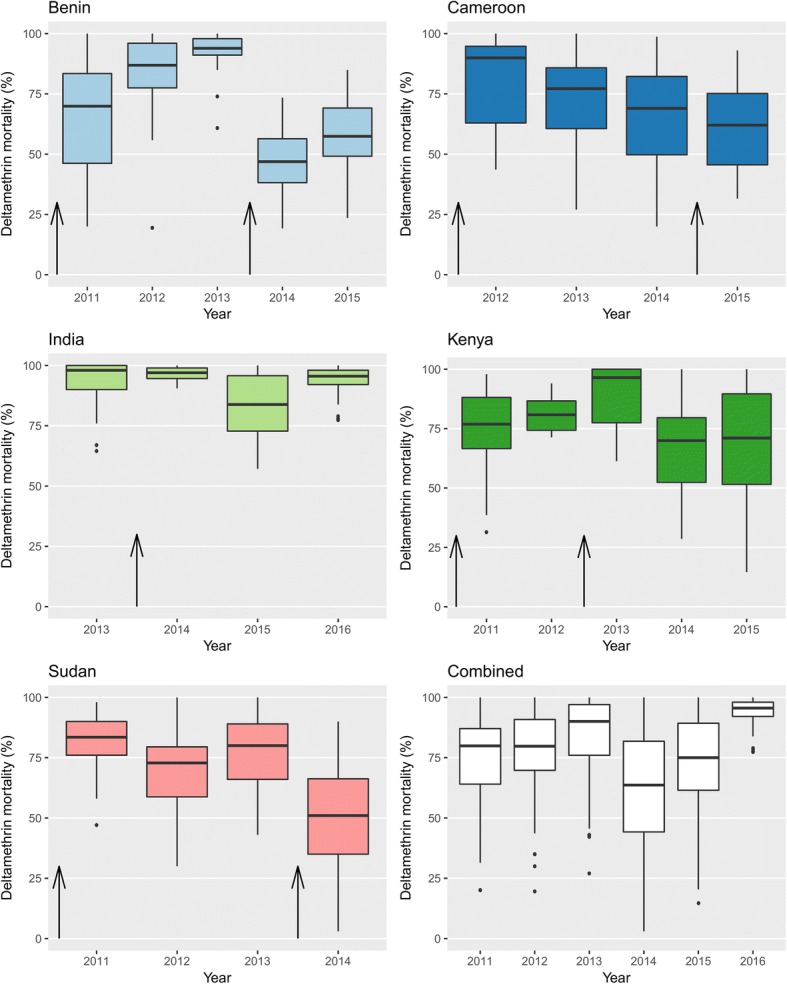
Box-and-whisker plots showing the range of cluster-level mortality by year and country. Arrows indicate the timing of bednet distributions within country

Box-and-whisker plots showing the range of cluster-level mortality by year and country. Arrows indicate the timing of bednet distributions within country