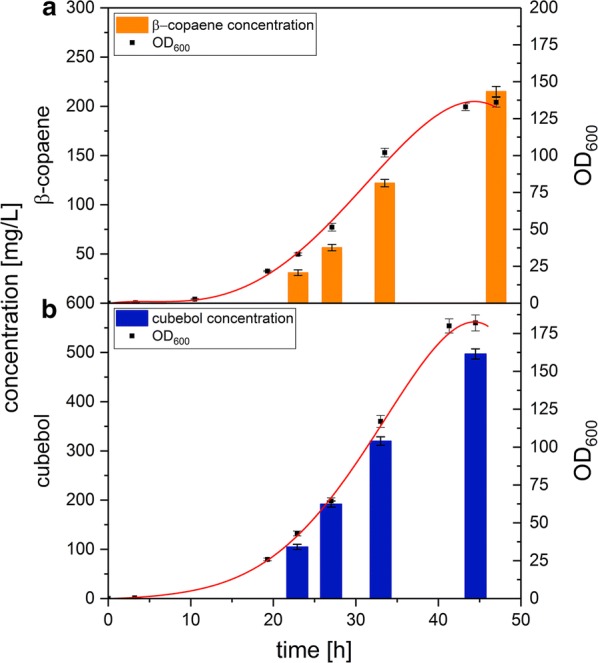
Fig. 6.

E. coli growth curves and time-dependent concentration of β-copaene and cubebol in controlled fed-batch fermentations. Expression of Copu2 (a) and Copu3 (b) in E. coli resulted in a constant concentration increase, which was finally limited by the stationary phase. The error bars represent the mean values ± standard deviation of technical triplicates
