Fig. 3.
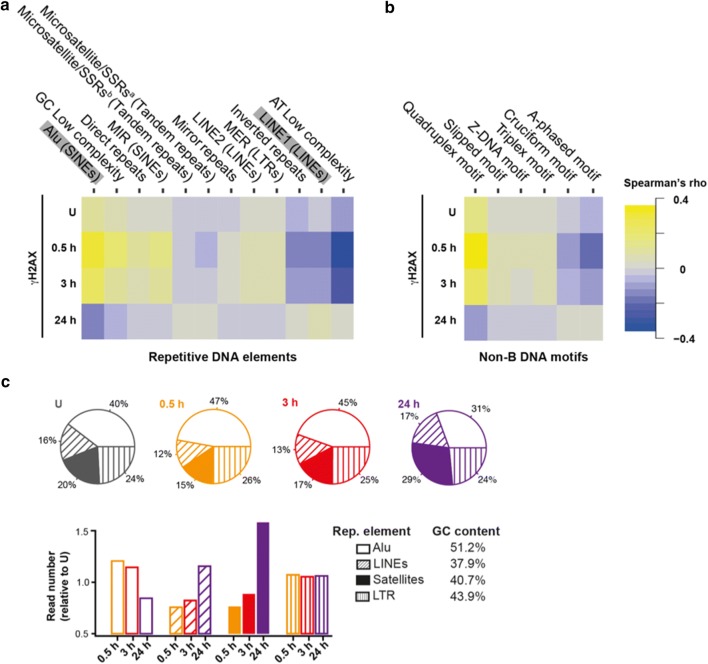
Genome-wide DNA repair kinetics of non-B and repetitive DNA elements. a Spearman’s rho correlation matrix between repetitive a and non-B b DNA elements and γH2AX levels before and after (0.5, 3 and 24 h) IR in HeLa cells. Calculation of the correlation coefficient is as in Fig. 1. c (top) Pie-charts showing the distribution of read counts for Alu, LINEs, satellites and LTR repetitive DNA elements, before and after (0.5, 3 and 24 h) IR. (bottom) Bar-plots showing the relative enrichment for the repeat element indicated after (0.5, 3 and 24 h) IR. The number of reads for a given repetitive element and at a given time point was normalized over the corresponding number of reads before IR (for details see Materials and methods section). The respective GC content of the repeat is indicated (whole human genome GC content is 43%)

