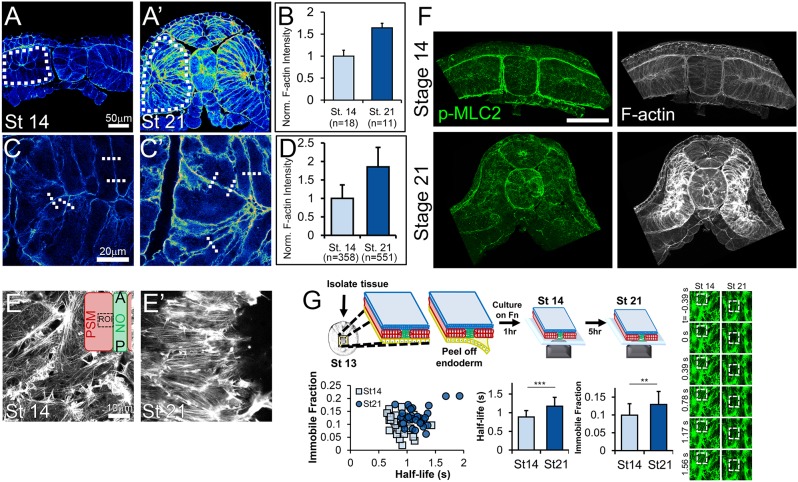
Fig. 4.
F-actin is enhanced and stabilized in mesoderm during neurulation. (A-D) Transverse sections of stage 14 (A,C) and stage 21 (A′,C′) dorsal tissues stained for F-actin reveal an increase in mesodermal F-actin abundance. Bulk measurements of mean phalloidin intensity within mesoderm cells (dotted white ROIs) reveals a 70% increase in intensity (A-B; Mann–Whitney U test, P<0.01). Phalloidin intensity was also measured by comparing max intensities across lines drawn perpendicular to cortex (dashed white lines), revealing an 85% increase (C-D; Mann–Whitney U test, P<0.001). F-actin intensity plots are normalized to mean stage 14 intensity. (E,E′) High-resolution confocal images of the endoderm-side mesodermal F-actin network at stage 14 (E) and stage 21 (E′) reveal alignment and polarization of F-actin network by stage 21. Inset in E illustrates the location of the ROI within the presomitic mesoderm and adjacent to the notochord. (F) Transverse sections of stage 14 and 21 dorsal isolates stained for p-MLC2 and F-actin. Scale bar: 100 µm. (G) Top: Schematic of F-actin FRAP experiment. Dorsal isolate tissues were isolated from stage 13 embryos injected with an F-actin live reporter (LifeAct-GFP), and the endoderm was peeled off and cultured on fibronectin to stage 14. Right: FRAP experiments were performed on stage 14 (n=32 cells) and stage 21 (n=30 cells) tissues. Representative FRAP experiment showing ∼50% bleach at 0 s with full recovery by 1.5 s. Dashed boxes indicate bleached area. Bottom: Stage 21 mesoderm tissues had higher immobile fraction and half-life (**P<0.002, ***P<0.0001; Student's t-test) compared with stage 14 tissues. Error bars represent s.d.

