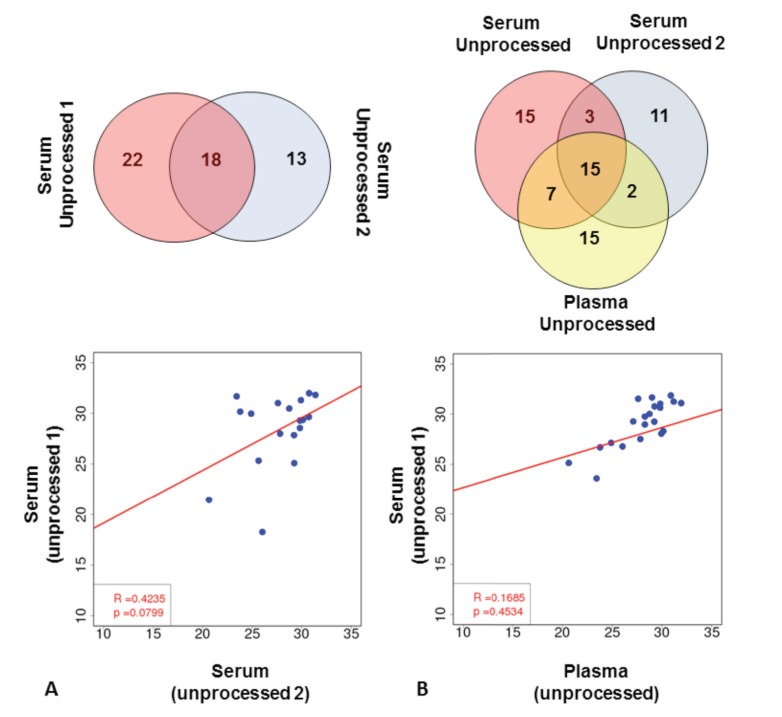
Fig. (1).
Extraction-free miRNA detection results in low number of detected miRNAs. (A) Comparison of array results in unprocessed serum samples. Top panel shows miRNAs detected in two independent serum samples from the same subject. Bottom panel shows regression analysis of miRNAs detected in both samples (based on Ct values). (B) Comparison of array results from two unprocessed serum and one unprocessed plasma sample. Top panel shows miRNAs detected in all three samples. Regression analysis of one unprocessed serum sample and unprocessed plasma sample is shown (based on Ct values).

