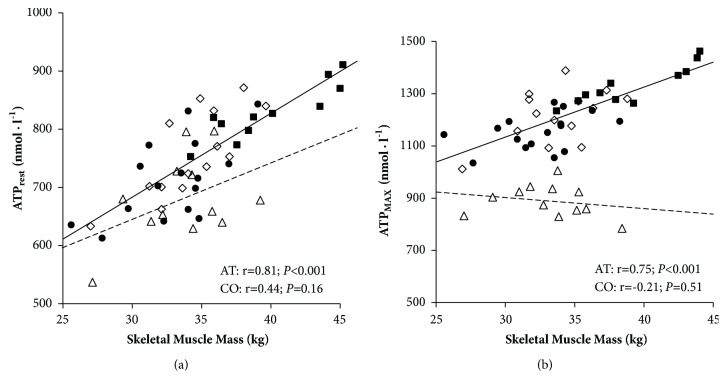
Figure 3.
Relationship between skeletal muscle mass and plasma ATP concentration at rest (a) and maximal exercise (b) in competitive athletes (AT, solid line; including sprinters SP, n=11, ■; futsal players FU, n=14 ◊, and endurance athletes EN, n=16, ●) and control group (CO, n=12, dashed line, ∆).

