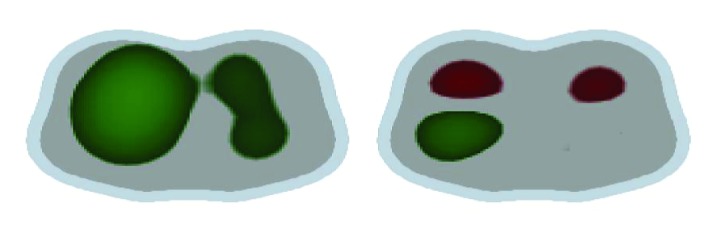
Figure 5.
Electrical Impedance Tomography. Example of the visualization of the variation in pulmonary ventilation seen through EIT of MV weaning in two ARDS patients in the first 2 hours. Image on the left indicates the gain in ventilation in green with an increase in TV from 6 to 12 ml/kg. The patient on the right showed weaning failure and prolonged weaning from MV. Image displays an increase in TV from 6 to 8 ml/kg and loss of ventilation variation in red; the patient showed simple weaning from MV.

