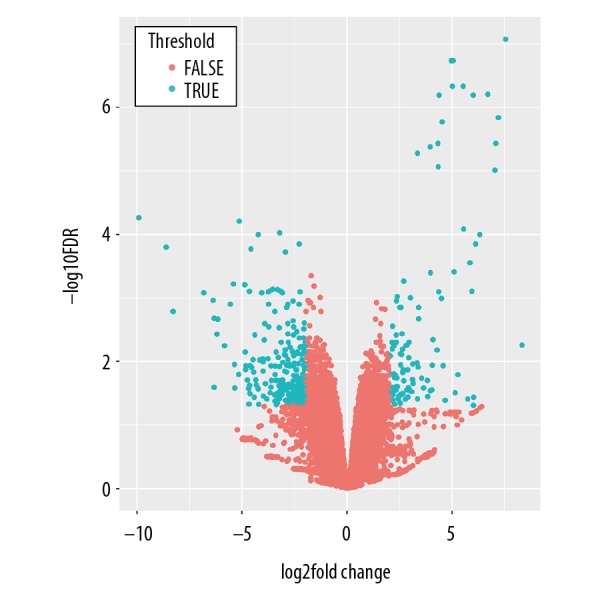
Figure 1.

Volcano plot shows the distribution of upregulated and downregulated DEGs. The X-axis indicates the fold change and Y-axis indicating the -log10 FDR value. DEGs upregulated with a fold change >2 and FDR <0.05 are depicted in red, and those downregulated with a fold change >2 and FDR <0.05 are shown in turquoise. DEGs – differentially expressed genes; FDR – false discovery rate.
