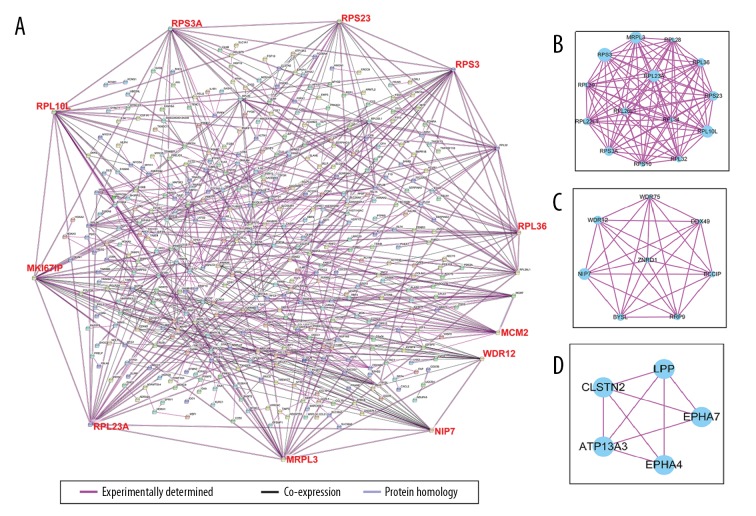
Figure 3.
Module analysis of the PPI network for DEGs using data based on the STRING dataset. (A) The PPI network for the total DEGs, and hub genes located at the edge of the PPI network. (B–D) Functional submodules of the PPI network analyzed by Cytoscape. DEGs – differentially expressed genes; PPI – protein-protein interaction.

