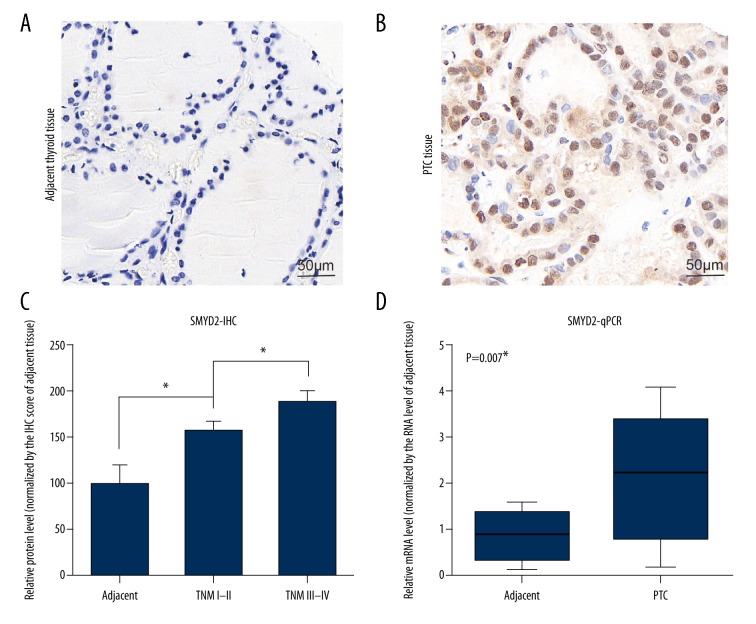
Figure 1.
Analysis of SMYD2 expression in patients with PTC. (A, B) IHC staining of SMYD2 in adjacent thyroid tissues (A) and PTC tissues (B). (C) Correlation between relative protein level of SMYD2 and different TNM stages. (D) RNA levels of SMYD2 were examined in PTC tissues and adjacent thyroid tissues. * P<0.05 by t test. Magnification: 400×.

