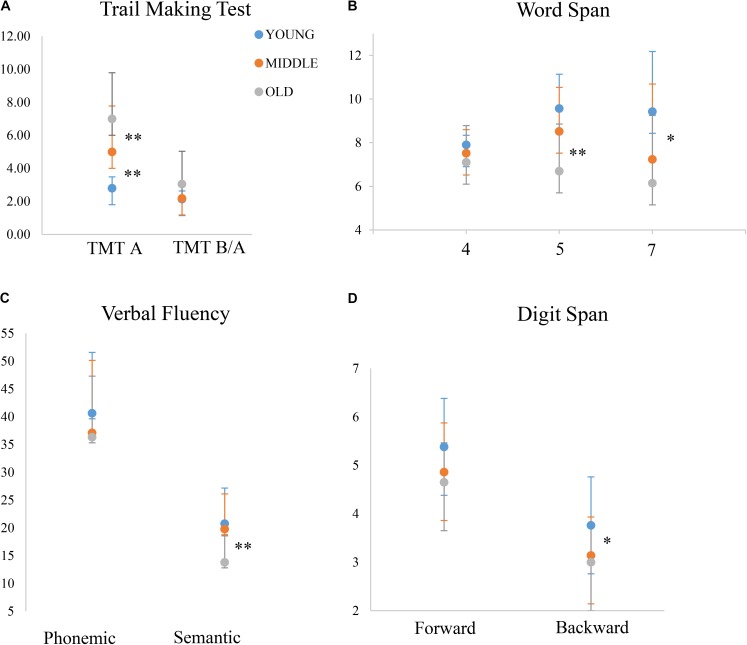
FIGURE 1.
Performance of the three age-groups on different tasks. y-axis depicts the outcome of each given test, either in terms of time (A) or score (B–D). The middle-old group performs similarly to the young-group on certain tasks, while similarly to the old-old group on others. Note that for TMT B/A, the young and the middle-old group’s performances overlap almost completely. ∗p ≤ 0.05; ∗∗p ≤ 0.01; for visualization purposes, this figure only shows significant differences between the middle-old group and the other two groups, while differences between the young and the old-old group are omitted.

