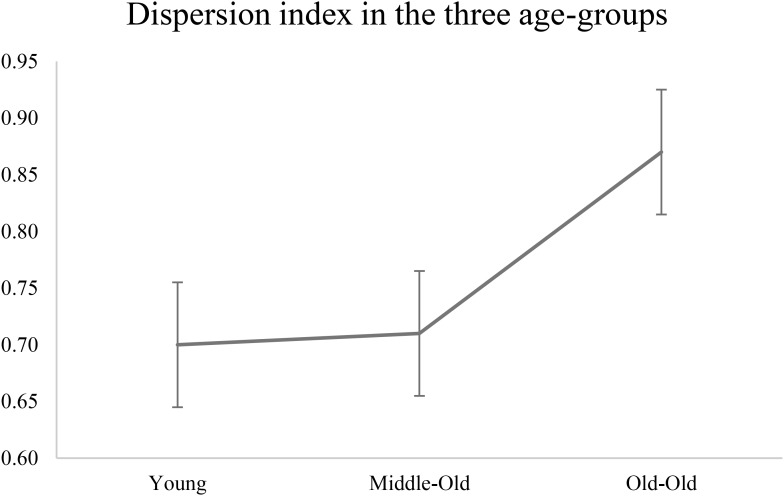
FIGURE 2.
Dispersion index plotted for the three age-groups. The graph shows a non-linear increase in dispersion index as a function of age groups (see Table 1, hypothesis A). Young adults aged 22–31; Middle-Old adults aged 59–71; Old-Old adults aged 76–91 (independent t-test young vs. middle p = 0.93; middle vs. old-old p = 0.08; young vs. old-old p = 0.10).

