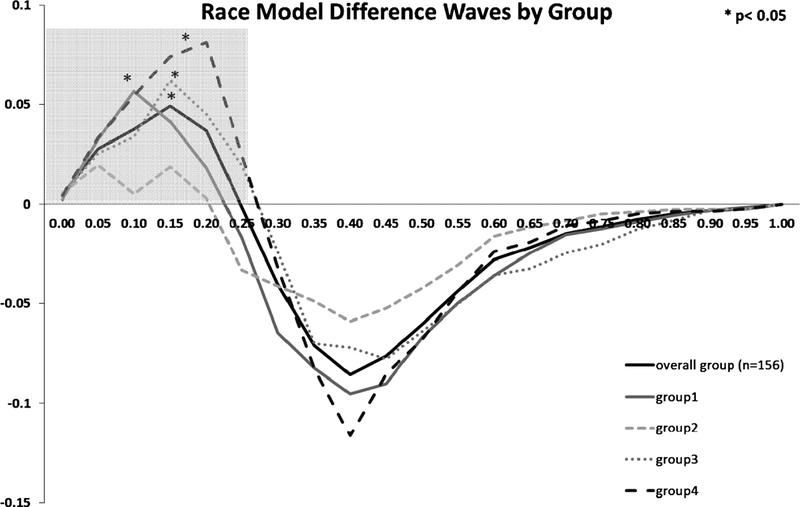
Figure 3.
Test of the Race Model. The cumulative probability difference waves (actual minus predicted) over the trajectory of averaged responses for the overall group and the four sensory combination groups. The shaded grey box represents the fastest quartile of RTs (i.e., 25th percentile). Values greater than zero indicate violations of the race model.

