
Figure 3:
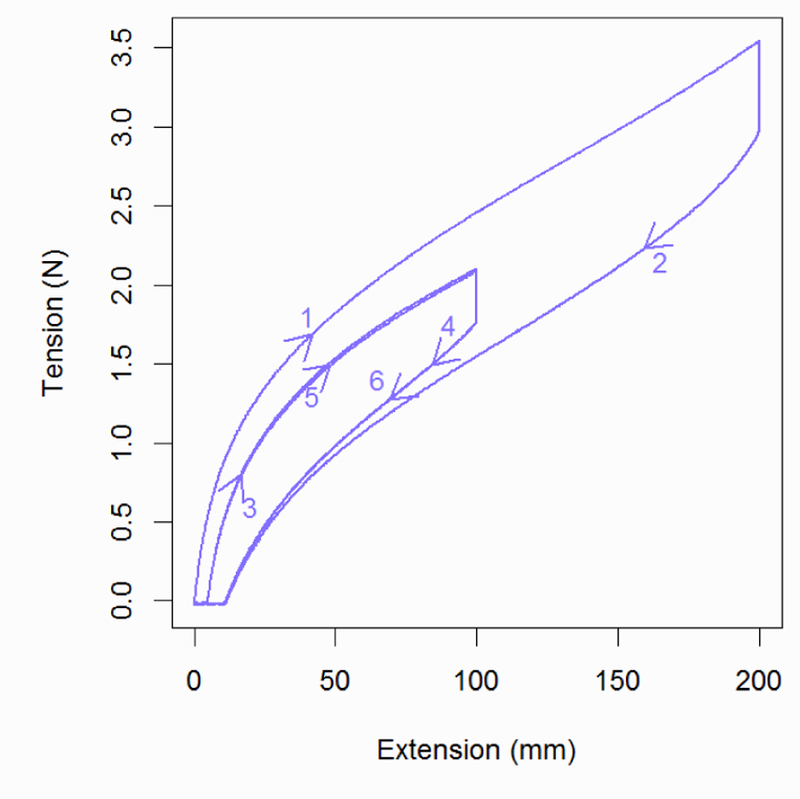
Stress-strain plot showing several stress-strain cycles for a sample from Manufacturer ‘A.’ Arrows and labels indicate the sequence, with odd numbered arrows indicating pulls and even indicating relaxations. Specific arrow placement along the curve was chosen solely for clarity. The two cycles after the first (3–4 and 5–6 on the graph) are nearly replicative.